Market and Economic Outlook - Released 9/30/25
Key takeaways
- The Fed began cutting rates due to slowing job growth and rising employment risks, while persistent inflation limits larger cuts; meanwhile, strong consumer activity and AI spending continue to support Gross Domestic Product (GDP) growth.
- Strong Q3 returns were driven by AI-fueled earnings, but high valuations and speculative rallies—especially in small caps—underscore risks if AI spending slows, reinforcing the need for disciplined, quality-focused investing.
- Falling money market rates and stable inflation make longer-duration bonds more attractive than cash, with investment-grade yields near 5%.
There is a well-known Wall Street adage: “Bull markets don’t die of old age.” While its origin may be unclear, the message remains relevant. Markets typically do not decline simply because they have been rising for a long time. Instead, bull markets tend to end due to identifiable catalysts such as economic shocks, policy shifts, or central bank actions.
Investor sentiment, often driven by what economist John Maynard Keynes called “animal spirits,” plays a powerful role in market behavior. These psychological forces can fuel rallies in risk assets but are inherently volatile, making market timing especially challenging. With the S&P 500 near all-time highs, markets are priced for continued good news. At the same time, U.S. investment-grade bond yields remain attractive, offering a compelling alternative to equities despite falling interest rates. Supportive fiscal measures like extended tax cuts and reduced regulation create a favorable backdrop for risk assets.
However, several risks are beginning to emerge. A cooling labor market and persistent inflation increase the likelihood of policy missteps by the Federal Reserve, which could affect asset prices. Over the longer term, rising fiscal deficits add another layer of uncertainty, particularly regarding the future strength of the U.S. dollar. Tariff-related disruptions, while less severe than initially feared, continue to weigh on consumer spending, a key driver of economic growth.
Following the recovery from April stock market lows, we have returned to a neutral outlook on risk assets. This reflects our long-term investment philosophy, which emphasizes aligning portfolio positioning with historical risk-return profiles. Stocks have typically delivered annual returns of 10–11% with higher volatility, and bonds have offered 4–5% returns with lower risk. Given our expectation that both stock and bond markets will trend near these historical averages over the next few years, we see no compelling reason to deviate from a neutral allocation at this time.
While we remain neutral, we continue to favor exposure to best-in-class companies with durable business models that can weather market cycles and deliver long-term value. In today’s environment of elevated uncertainty and limited areas of clear value, we believe maintaining broad diversification and a disciplined approach is prudent.
Prepare for dissent
And so, we begin…again. After holding rates steady at their July meeting, the Federal Open Market Committee (FOMC) voted to cut the federal funds rate by a quarter of a percentage point to a range of 4.0% to 4.25% in their September 16-17 meeting with more rate cuts likely to come. In the official press release for the September meeting, the committee added a comment that “job gains have slowed” and “that downside risks to employment have risen”, both of which were not in the July press release. This came after a 911,000 negative payroll revision to job growth for the 12-month period through March 2025, as well as recent non-farm payrolls that have come down considerably since the beginning of the year. This was the primary driver of the decision to cut rates, while inflation having crept higher kept the group from a larger half point decline.
Inflation still lingers above their 2% target, and the group must take that into consideration. The Consumer Price Index and Personal Consumption Expenditures Price Index have both moved back up to 2.9% and 2.7%, respectively, over the past year. Moving forward, markets appear to be pricing in a 0.25%-point rate cut at each of the next two meetings with a pause at the January meeting. This is consistent with the path that FOMC members believe the fed funds rate will move as well. We agree that this first cut won’t be the last and we see another one or two cuts to end the year. Moving forward, the FOMC will likely tilt their actions in favor of their maximum employment mandate versus stable prices.
Strong consumer, sinking sentiment
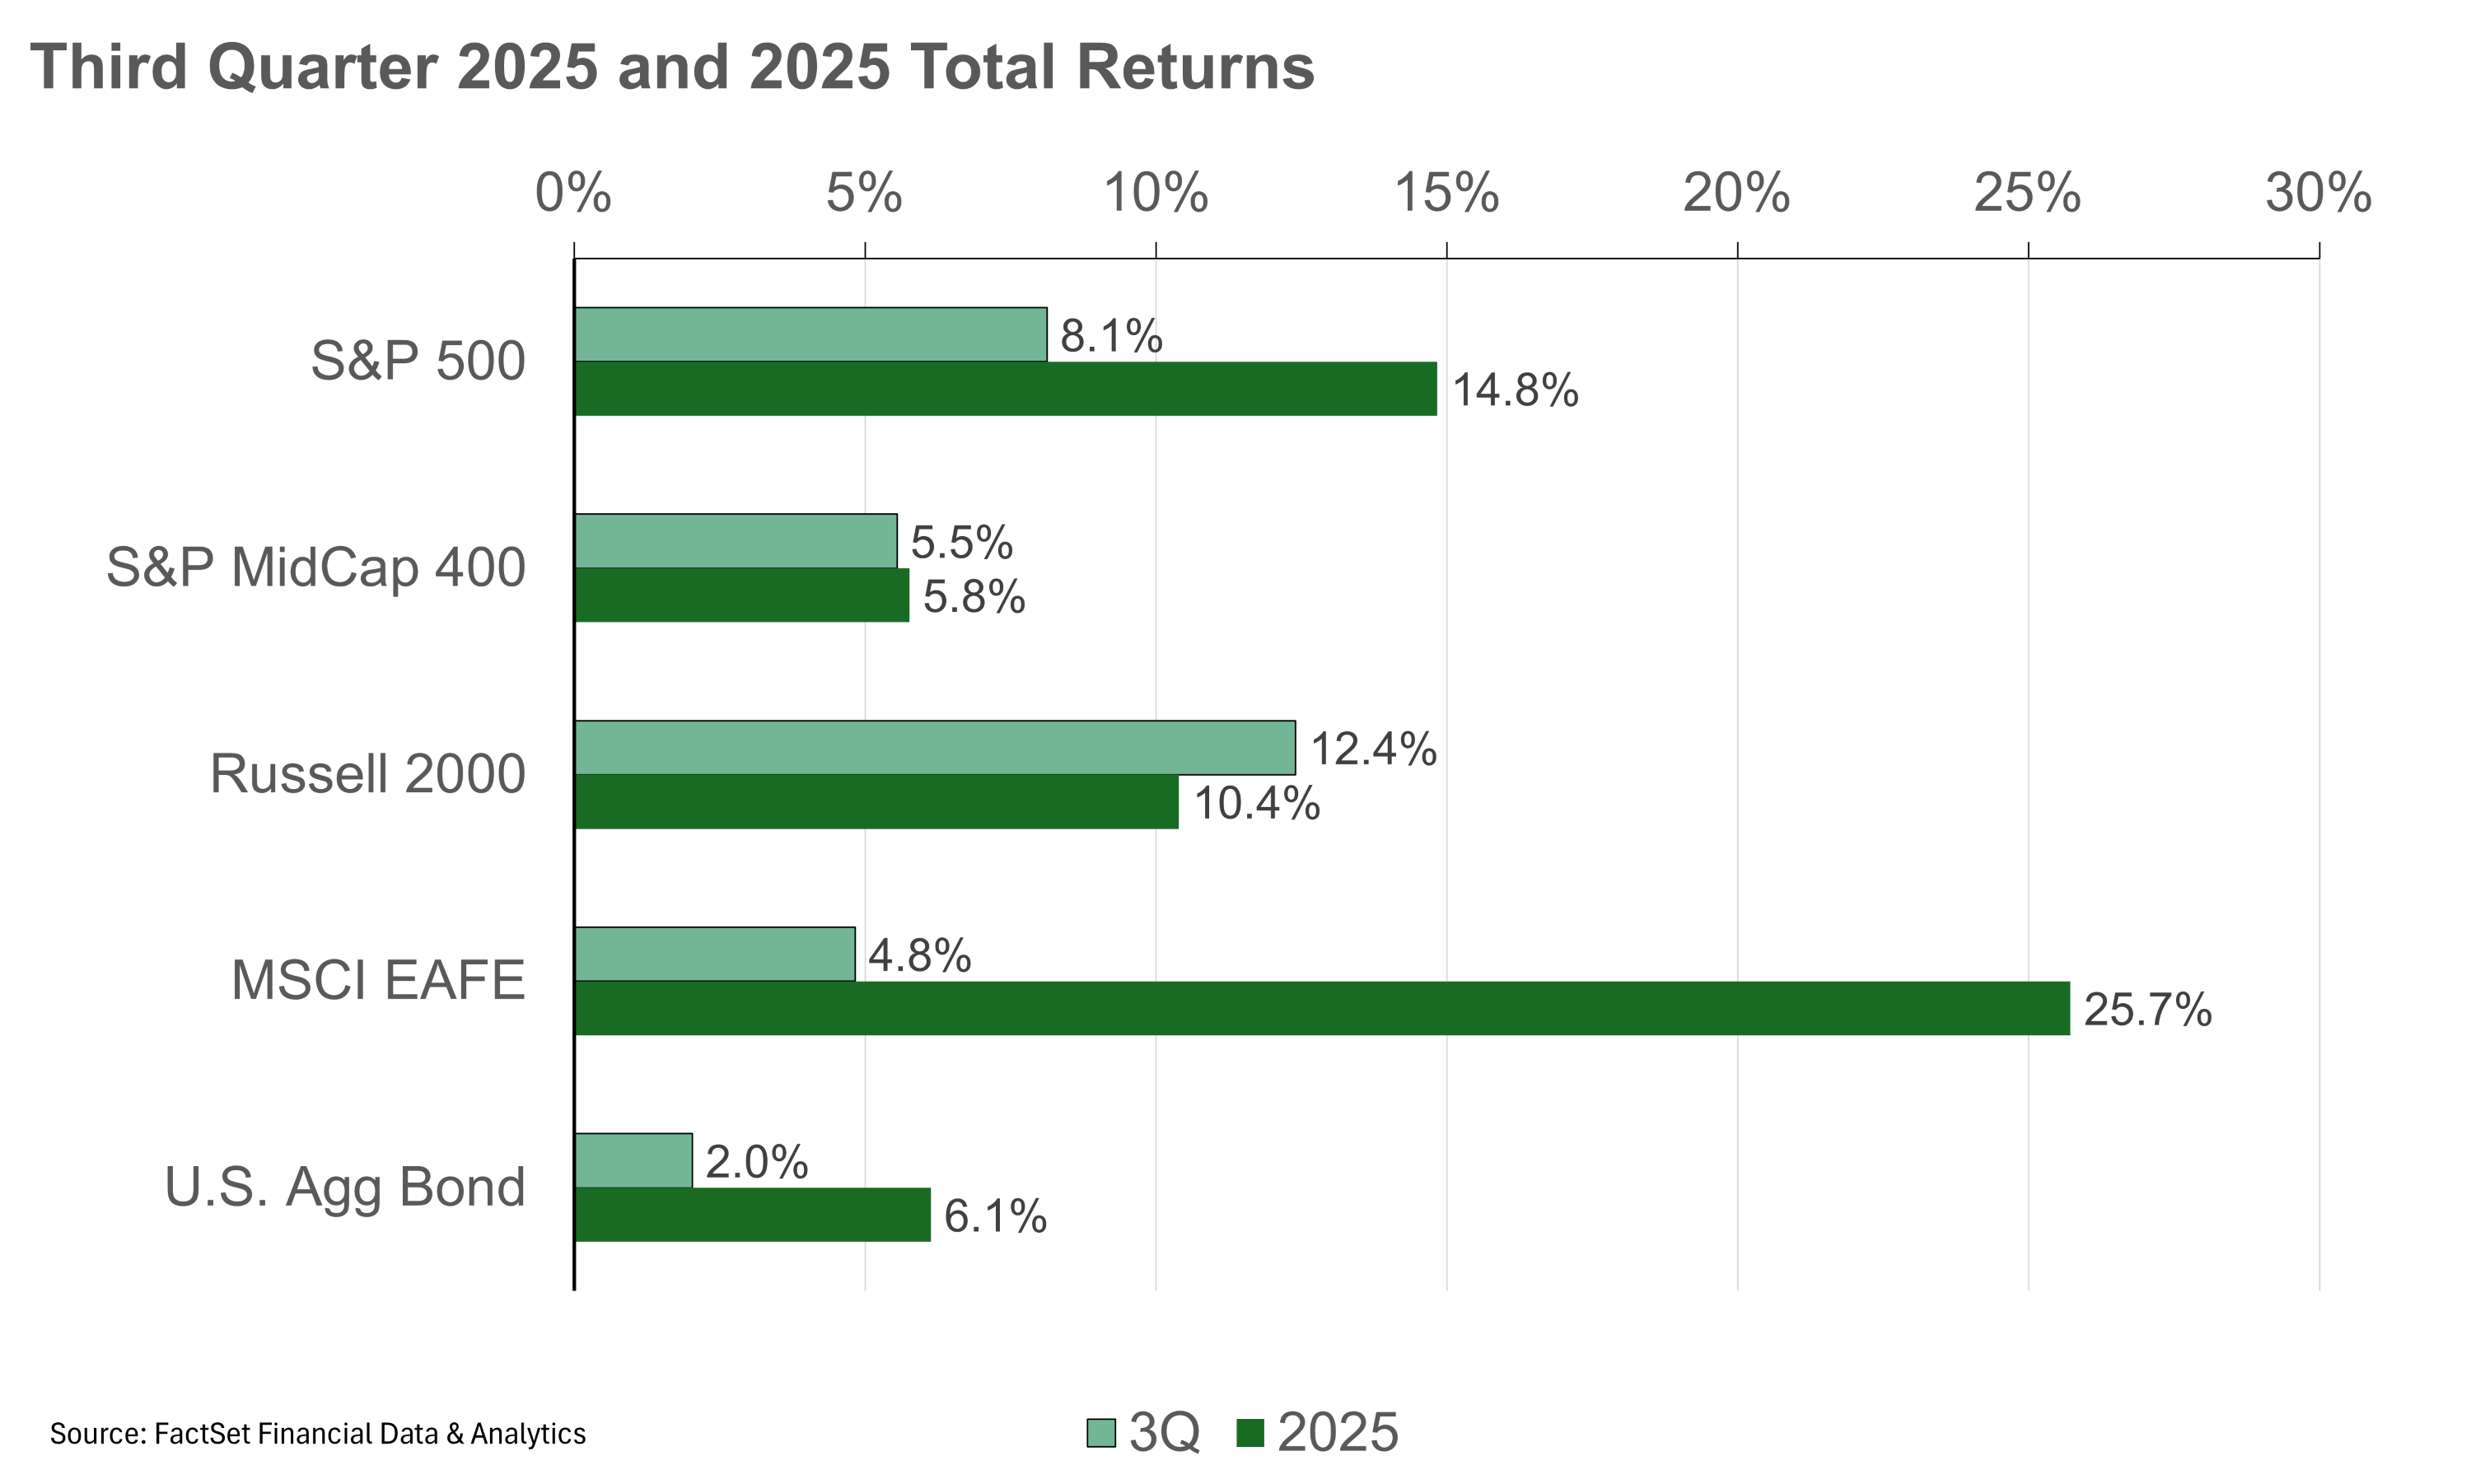 Figure 1
Markets carried the momentum gathered in the second quarter into the third quarter. U.S. markets flipped the script this quarter and outpaced international developed markets but still trailed emerging markets which rose 10.9% with China up over 20%. And unlike the last two quarters, the U.S. dollar was a detractor from international returns rising nearly 1%. Bonds continued their steady return cadence providing another 2% as short-term Treasury rates dropped in anticipation of the Fed’s first rate cut of the year (Figure 1).
Helping markets is a still strong U.S. consumer. Readings for second quarter Gross Domestic Product (GDP) show consumer spending has increased by a seasonally adjusted annual rate of 2.5% and contributes just half of the quarter’s growth. Retail sales continue to show growth above expectations as well with July retail sales growing 0.5% and August growing 0.6%. Artificial Intelligence (AI) spending is also driving strong growth. Given the impact AI has had, this is also an area that we are keeping a close eye on. A slowdown in this spending would have a negative impact on overall U.S. GDP growth. We do not see this spending slowing down any time soon, and the Atlanta Fed’s GDPNow model is forecasting third quarter GDP growth of 3.9%.
Consumers were also helped by the One Big Beautiful Bill Act (OB3) which made the current individual income tax brackets permanent beyond 2025 as well as the child tax credit with an increased maximum. (For more information, take a look at our OB3 Highlights piece.)
Consumer sentiment, however, dropped throughout the quarter. The Current Conditions Index dropped by 11% while the Consumer Expectations Index dropped by 10%. There is still frustration among consumers around high prices, and while year-ahead inflation expectations remain high, they are well off the highs seen in May (Figure 2).
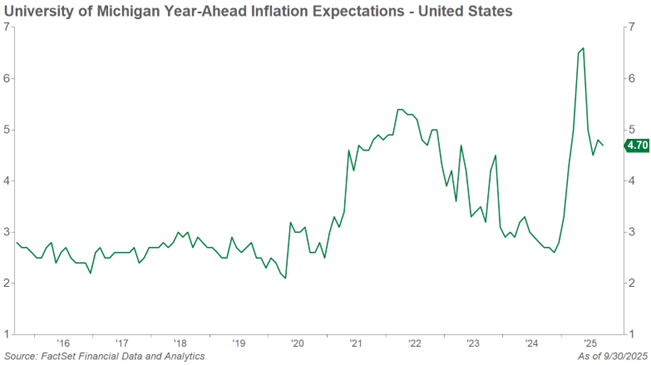 Figure 2
AI drives earnings growth
The stock market took the divergent economic data and Federal Reserve rhetoric in stride, continuing its pace of positive returns for the year. The S&P 500 returned 8.12% in the third quarter, benefiting from continued strong earnings growth that outpaced expectations. Following the mid-year rally, large-cap stocks now screen expensive, as they are trading on the high end of 10-year averages of their price-to-earnings ratio.
We believe that trends related to Artificial Intelligence (AI) can support continued earnings growth going forward, and we continue to look for signs that companies down the market cap spectrum may also be AI beneficiaries as they leverage emerging technologies for efficiency gains. We continue to monitor these trends, particularly noting that earnings expectations for the S&P 500 reported for the third quarter have come in slightly over the last few months. We remain conscious interruptions in AI capital investment could impact future earnings growth as much of the recent earnings growth for the S&P 500 was associated with AI stocks. If AI fails to deliver on its expected potential, we believe it is a risk for continued market expansion, especially at current valuation levels.
Speculative rally in small caps
Small cap stocks rallied in the third quarter, outperforming their large cap peers, with the Russell 2000 Index returning 12.39% (Figure 3). A closer look at Russell 2000’s performance during the quarter reveals some notable trends, particularly around the types of stocks that saw sharp price rallies during the quarter which helped drive the benchmark’s outperformance. Interestingly, companies with the most negative earnings growth and those with the highest stock price volatility significantly outperformed their more stable counterparts. In contrast, companies with positive earnings growth and lower volatility underperformed by a wide margin. According to our research, 46% of companies within the Russell 2000 Index are also not profitable. In our view, this lower quality rally may suggest that small cap stocks are pricing in continued aggressive federal reserve intervention and a declining interest rate environment which we believe may be overly optimistic. Small cap stocks continue to look attractive from a valuation perspective, but we believe in investing in high quality businesses with durable franchises that can support earnings growth and positive cash flows going forward.
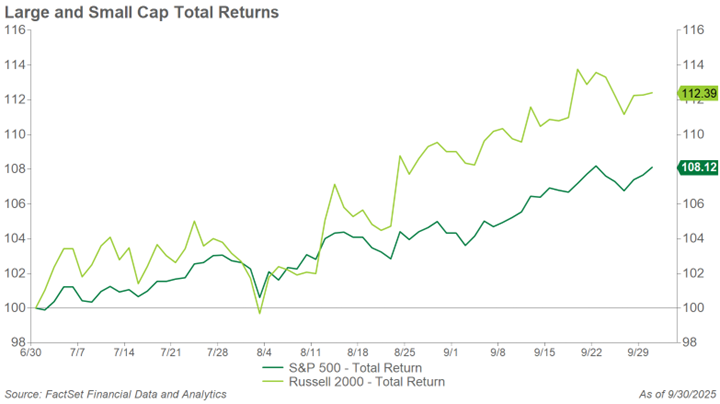 Figure 3
Speculative stock rallies like we saw in the third quarter, particularly within small cap stocks, do happen on occasion, and investors with portfolios of high-quality stocks may find themselves underperforming major benchmarks for various reasons. Fear of missing out may provoke investors to chase rallies in non-earning speculative stocks. We continue to emphasize a measured approach to investing in the stock market that aligns with a strong financial plan and still takes an appropriate level of risk for that plan’s goals.
Coupon comeback
The investment grade bond market continues to offer attractive yields, even with Treasury rates falling across the yield curve during the quarter. These starting yields offer compelling total return potential, driven by both steady coupon income and the possibility of price appreciation.
Even as the Federal Reserve begins to ease rates, intermediate and long-term yields are likely to remain elevated, preserving the appeal of fixed income investments. While we expect further rate cuts in the near term, longer-term risks such as tariffs and rising fiscal deficits could steepen the yield curve, keeping long-term interest rates elevated even as short-term rates decline.
We believe the interest rate outlook is priced in, with the Fed’s trajectory well understood by market participants. As a result, today’s fixed income strategy is less about anticipating rate moves and more about earning consistent income. The investment narrative has shifted from “TINA” (There Is No Alternative), where investors relied heavily on equities, to “PATTY” (Pay Attention to The Yield), emphasizing the value of income generation and the attractive yields bonds offer today.
With inflation expectations contained and investment grade corporate bond yields near 5%, the current environment is favorable for fixed income investors (Figure 4). As money market rates decline from last year’s peak, longer-duration bonds may offer better value than cash. Long-duration municipal bonds present compelling opportunities for investors in taxable accounts.
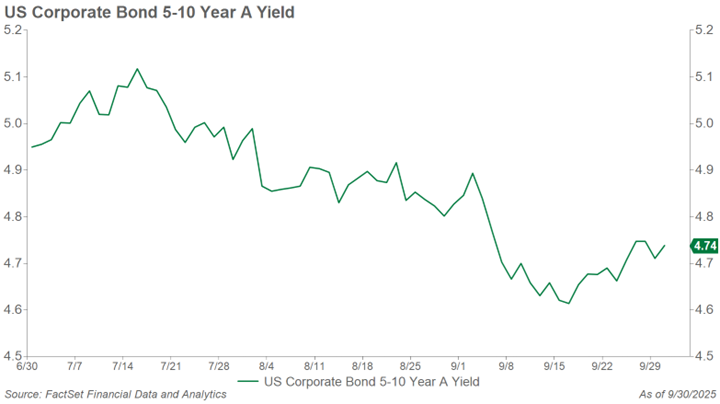 Figure 4
Debt dilemma
We continue to monitor the fiscal deficit, which remains a long-term concern. While the market is patient for now, structural reforms such as entitlement adjustments or tax increases may eventually be necessary. Fortunately, the U.S. benefits from its reserve currency status and deep capital markets, allowing it to borrow at lower costs and maintain strong global demand for Treasuries.
Over the past four years, deficits have risen, yet the debt-to-GDP ratio has remained steady thanks to robust nominal growth. In this context, deficits appear sustainable relative to economic expansion (Figure 5).
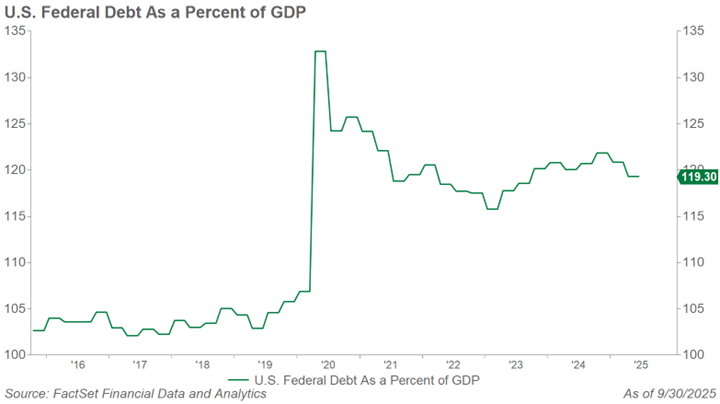 Figure 5
Many clients have asked about the risks of fiscal mismanagement. While rising deficit spending will eventually need to be addressed, it is difficult to predict when it will begin to negatively impact financial markets. Rather than expecting a sudden market disruption, we anticipate a gradual erosion of returns over time. Higher debt levels will lead to increased Treasury issuance, higher interest rates, slower economic growth, and a crowding-out effect on private investment. In today’s environment, it is wiser for investors to plan for lower long-term returns than to try to predict the exact timing of a debt crisis and a sharp market downturn.
The bottom line
As always, we remain focused on long-term fundamentals and disciplined portfolio management. While markets may continue to climb, rising risks and stretched valuations in certain areas call for caution. In this environment, maintaining a neutral allocation, broad diversification, and exposure to high-quality companies is essential. We appreciate the continued trust in COUNTRY Trust Bank and remain committed to helping our clients navigate the evolving market landscape with confidence, from the end of this bull market to the beginning of the next.
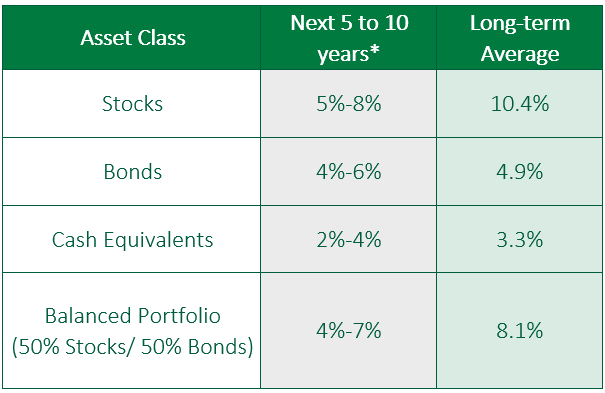 Figure 6
*Forecasted average annual returns of COUNTRY Trust Bank Wealth Management
Source: Morningstar and COUNTRY Trust Bank® - See Definitions and Important Information below
COUNTRY Trust Bank® Wealth Management Team
- Troy Frerichs, CFA - VP, Investment Services
- Jeff Hank, CFA, CFP® - Manager, Wealth Management
- G. Ryan Hypke, CFA, CFP® - Portfolio Manager
- Beau Lartz, ChFC® - Investment Analyst
- Cody Behrens, CFA, ChFC® - Investment Analyst
- Emily Meldrum, CPA - Investment Analyst
- Chelsie Moore, CFA, CFP® - Director, Wealth Management & Financial Planning
- Kent Anderson, CFA - Portfolio Manager
- Jonathan Strok, CFA - Portfolio Manager
- Michelle Beckler - Investment Analyst
- Samantha Reichert - Investment Analyst
Looking for help navigating your future?
Set up a meeting with your local rep to review your current policies and make sure they're up to date. We pulled together some less obvious reasons to adjust your coverage.
COUNTRY Financial® is a family of affiliated companies (collectively, COUNTRY) located in Bloomington, IL. Learn more about who we are.
NOT FDIC-INSURED
May lose value
No bank guarantee
All information is as of the report date unless otherwise noted.
This material is provided for informational purposes only and should not be used or construed as investment advice or a recommendation of any security, sector, or investment strategy. All views expressed and forward-looking information, including forecasts and estimates, are based on the information available at the time of writing, do not provide a complete analysis of every material fact, and may change based on market or other conditions. Statements of fact are from sources considered reliable, but no representation or warranty is made as to their completeness or accuracy. Unless otherwise noted, the analysis and opinions provided are those of the COUNTRY Trust Bank investment team identified above and not necessarily those of COUNTRY Trust Bank or its affiliates.
Diversification, asset allocation and rebalancing do not assure a profit or guarantee against loss. All market indexes are unmanaged, and returns do not include fees and expenses associated with investing in securities. It is not possible to invest directly in an index.
Investment management, retirement, trust and planning services provided by COUNTRY Trust Bank®.
Past performance does not guarantee future results. All investing involves risk, including risk of loss.
Definitions and important information
Figures 1,2,3,4,5: Data sourced from FactSet Research Systems Inc, a global provider of integrated financial information, analytical applications and services for the investment and corporate communities.
Figure 6: The long-term average return data comes from Morningstar and is based upon compound average annual returns for the period from 1926 through December 31, 2024. Stocks are represented by the Ibbotson® Large Company Stock Index, which is comprised of the S&P 500® Composite Index from 1957 to present, and the S&P 90® Index from 1926 to 1956. Bonds are represented by the Ibbotson® U.S. Intermediate-Term Government Bond Index. Cash Equivalents are represented by the 30-day U.S. Treasury bill. The “Balanced Portfolio” is representative of an investment of 50% stocks and 50% bonds rebalanced annually. Forecasted stock returns include small capitalization and international equities. Forecasted bond returns include investment grade corporate bonds. These returns are for illustrative purposes and not indicative of actual portfolio performance. It is not possible to invest directly in an index.
Stocks of small-capitalization companies involve substantial risk. These stocks historically have experienced greater price volatility than stocks of larger companies, and they may be expected to do so in the future.
International investing involves risks not typically associated with domestic investing, including risks of adverse currency fluctuations, potential political and economic instability, different accounting standards, limited liquidity, and volatile prices.
Fixed income securities are subject to various risks, including changes in interest rates, credit quality, market valuations, liquidity, prepayments, early redemption, corporate events, tax ramifications and other factors. Debt securities typically decrease in value when interest rates rise. The risk is usually greater for longer-term debt securities. Investments in lower-rated and nonrated securities present a greater risk of loss.
The S&P 500® Index is an unmanaged index consisting of 500 large-cap U.S. stocks. The index does not reflect investment management fees; brokerage commission and other expenses associated with investing in equity securities.
The S&P Midcap 400 is a stock market index published by Standard & Poor’s (S&P). It measures the performance of 400 mid-sized companies in the United States, providing a benchmark for this segment of the market. These companies typically have market capitalizations ranging from about $2 billion to $10 billion.
The MSCI EAFE Index measures international equity performance. It comprises the MSCI country indexes capturing large and mid-cap equities across developed markets in Europe, Australasia, and the Far East, excluding the U.S. and Canada.
The Russell 2000® Index measures the performance of the small-cap segment of the U.S. equity universe. It includes approximately 2000 of the smallest securities based on a combination of their market cap and current index membership.
The Bloomberg Aggregate Bond Index, often referred to as “the Agg,” is a broad-based benchmark that measures the performance of the U.S. investment-grade bond market. It includes a wide range of fixed-income securities.
Non-farm payrolls are collected by the U.S. Bureau of Labor Statistics (BLS) monthly through the establishment survey which provides information on employment, hours, and earnings of employees on non-farm payrolls.
GDP or Gross Domestic Product is the monetary value of all goods and services produced during a specified period. The figure is used as a barometer of an economy’s health including its size and growth rate. In the U.S., quarterly GDP figures are typically “annualized” meaning the quarterly growth is compounded for four quarters.
The Personal Consumption Expenditures (PCE) Price Index is a measure of the average change over time in the prices paid by consumers for goods and services. It is compiled by the U.S. Bureau of Economic Analysis (BEA) and is used to track inflation.
The Atlanta Fed’s GDPNow is a real-time economic model developed by the Federal Reserve Bank of Atlanta that provides a running estimate of U.S. gross domestic product (GDP) growth for the current quarter. Unlike official forecasts, it updates frequently—often daily—based on incoming economic data such as retail sales, employment, and inflation reports. While not an official government forecast, it’s widely followed for its timeliness and transparency in showing how new data affects GDP expectations.
The price-to-earnings ratio is a valuation ratio which compares a company's current share price with its earnings per share (EPS). EPS is usually from the last four quarters (trailing P/E), but sometimes it can be derived from the estimates of earnings expected in the next four quarters (projected or forward P/E). The ratio is also sometimes known as "price multiple" or "earnings multiple."
The yield curve plots the interest rates of similar-quality bonds against their maturities. The most common yield curve plots the yields of U.S. Treasury securities for various maturities. An inverted yield curve occurs when short-term rates are higher than long-term rates.
The federal funds rate is the interest rate at which depository institutions (like banks and credit unions) lend reserve balances to other depository institutions overnight on an uncollateralized basis. This rate is a key tool of U.S. monetary policy, set by the Federal Open Market Committee (FOMC) of the Federal Reserve. Changes in the federal funds rate can influence various economic factors, including inflation, employment, and the rates on consumer loans and mortgages.
Yield to Maturity (YTM) represents the total rate of return an investor can expect from a bond if they hold it until maturity and reinvest all interest payments at the same rate. It’s expressed as an annual percentage.
Credit spreads measure the difference in yields between bonds with the same maturity but different credit quality.
CPI stands for Consumer Price Index. It measures the average change over time in the prices paid by urban consumers for a basket of goods and services—such as food, housing, transportation, and medical care. CPI is a key indicator used to assess inflation and the cost of living.
The Consumer Sentiment Index measures how optimistic or pessimistic consumers are about the economy and their personal financial situation. It’s based on surveys that assess attitudes toward current conditions and future expectations, including income, employment, and inflation. A higher index indicates greater consumer confidence, which can signal stronger spending and economic growth, while a lower index suggests caution and potential economic slowdown.